


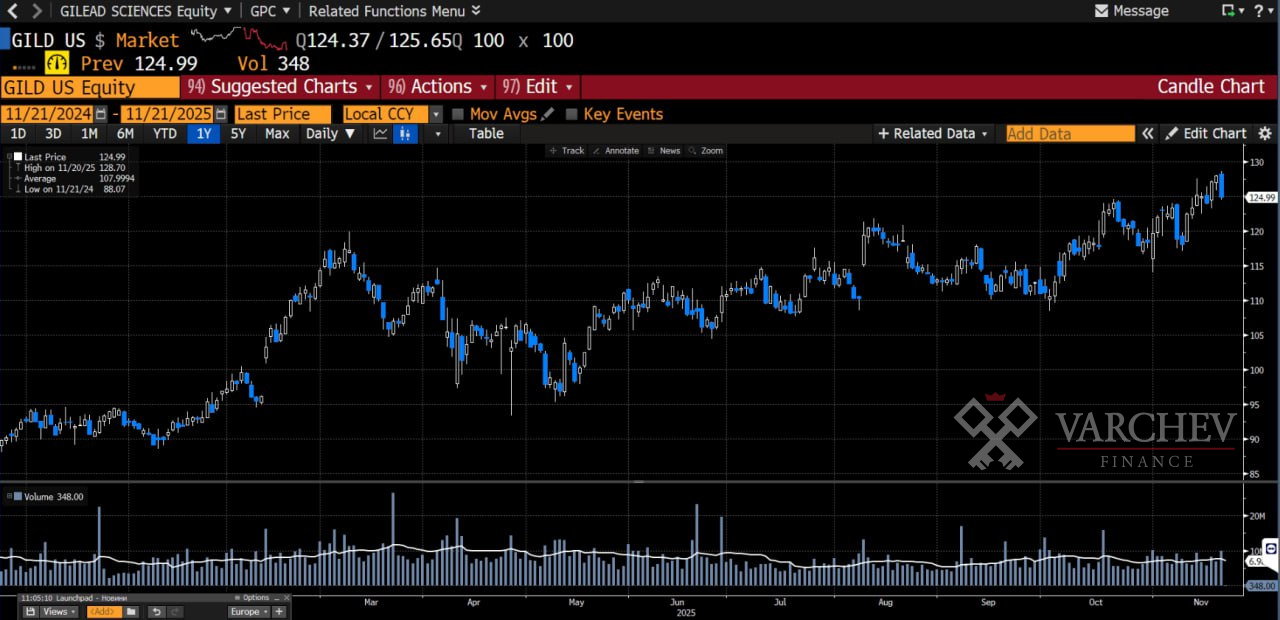
While the major stock indexes experience a turbulent fourth quarter, several sectors within healthcare are showing strong resilience. Pharmaceutical and biotech companies have generally outperformed the S&P 500 since the end of September, suggesting a potential “safe-haven” opportunity for investors concerned about market instability.
Today, we’ll take a closer look at one biotechnology company—Gilead Sciences (GILD)—and demonstrate how the combination of a long-term trend and short-term improvement could lead to significant gains by year-end.
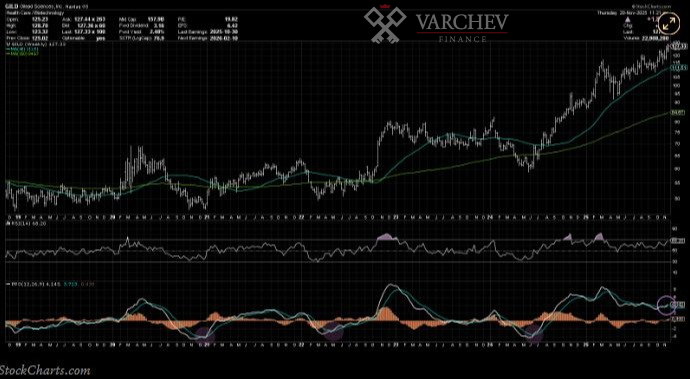
Starting with the weekly chart, we can see that the major low in April was actually just a pause within a much larger uptrend that began back in May 2024. A weekly PPO buy signal shortly after the May 2024 low initiated a new accumulation phase that likely continues through this week.
With GILD remaining above its 40-week moving average throughout 2025, along with a secondary buy signal from the weekly PPO this week, we view this chart as a long-term uptrend showing no signs of slowing as the holiday season approaches.
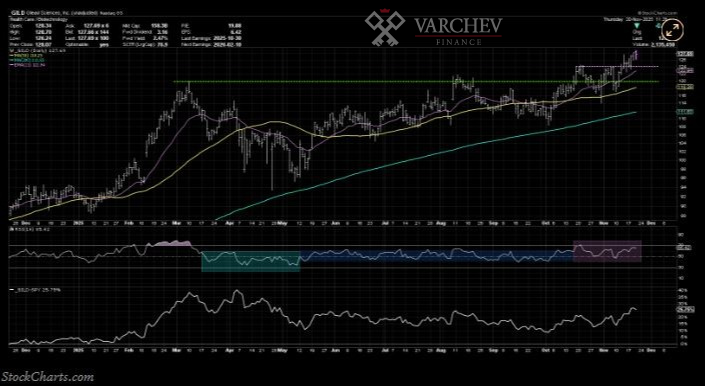
On the daily chart, we can focus more on the recent price action to see how the latest upswing represents a key breakout on improved momentum. In March, GILD reached a peak around $120 before dropping to the eventual low in April. In August, the stock retested the same resistance level before finally breaking above it in October.
GILD then established a secondary resistance level around $124, with the price subsequently retesting the 50-day moving average as support. Just last week, Gilead finally broke above all these resistance levels, indicating a new accumulation phase for this biotech giant.
The Relative Strength Index (RSI) shows how GILD has gone through several phases since the March 2025 peak. Momentum was bearish in April and May, with the RSI remaining below 60 during that period. From mid-May through mid-October, the RSI stayed in the neutral range between 40 and 60, indicating a balance between up days and down days. The price breakout in October was driven by stronger momentum, confirming a bullish RSI reading that remains valid this week.
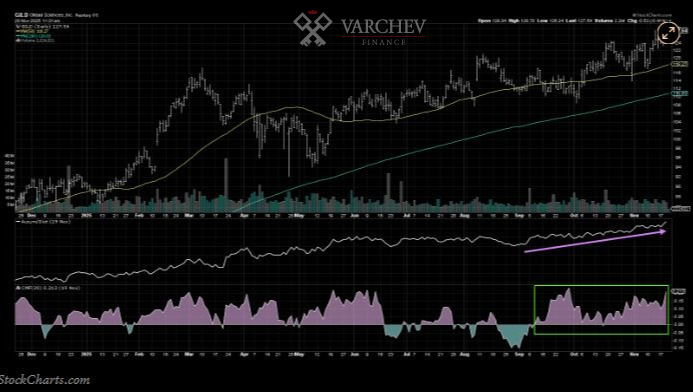
Strong volume support for the recent price action suggests that we can trust the strength of the current accumulation phase. With the accumulation–distribution line trending steadily higher and the Chaikin Money Flow firmly in positive territory, there are signs that this upswing is being driven by strong institutional support.
Investors looking to diversify away from overvalued technology stocks may be surprised to find that several defensive plays like Gilead are showing strong technical profiles. It’s always a good time to own “good charts.”
Varchev Absolute Trader
борсова платформа
- Търгувай над 3000 финансови инструмента: Crypto, Форекс, Акции, Индекси, Суровини, ETF-и
- Използвай платформа с директно изпращане ордерите на борсите
- Cloud base платформа - твоят трейдинг сетъп на всяко устройство
- Market Sentiment - търгувай с настроенията на инвестиционите банки
- Top movers - най-горещите трейдове във всеки един момент
- Stocks scanner - филтрирай най-подходящите за твоя трейдинг стил пазарни инструменти
- Heat map - Търгувай в посоката на големите играчи
Meta Trader 5
- Търгувай Crypto, Форекс, Акции, Индекси, Суровини - всичко на едно място
- Автоматизирана търговия с интелигентни стратегии и роботи (Expert Advisors)
- Разширен технически анализ с хиляди индикатора и инструменти
- Сигурност и стабилност – платформа, доверена от милиони по света
- Нулев марджин при насрещни/хеджирани позиции
- Без комисиона при търговия със CFDs
- Светкавично изпълнение на сделките
Read more:

Login to comment
Comments:
Leave a comment