


Was yesterday’s Ethereum rally a bullish trap ahead of the FOMC meeting? Itai Levitan, Head of Strategy at investingLive, uses orderFlow Intel to reveal the hidden answer.
Some claimed that Ethereum’s rally lacked volume, so we took a closer look. The claim came from a flashy Instagram post. Using orderFlow Intel, we examined the situation at a deep level.
Ethereum futures surged on December 9, rising from around 3,100 to 3,409 before correcting to the mid-3,300s. With the FOMC just hours away, traders are asking the key question:
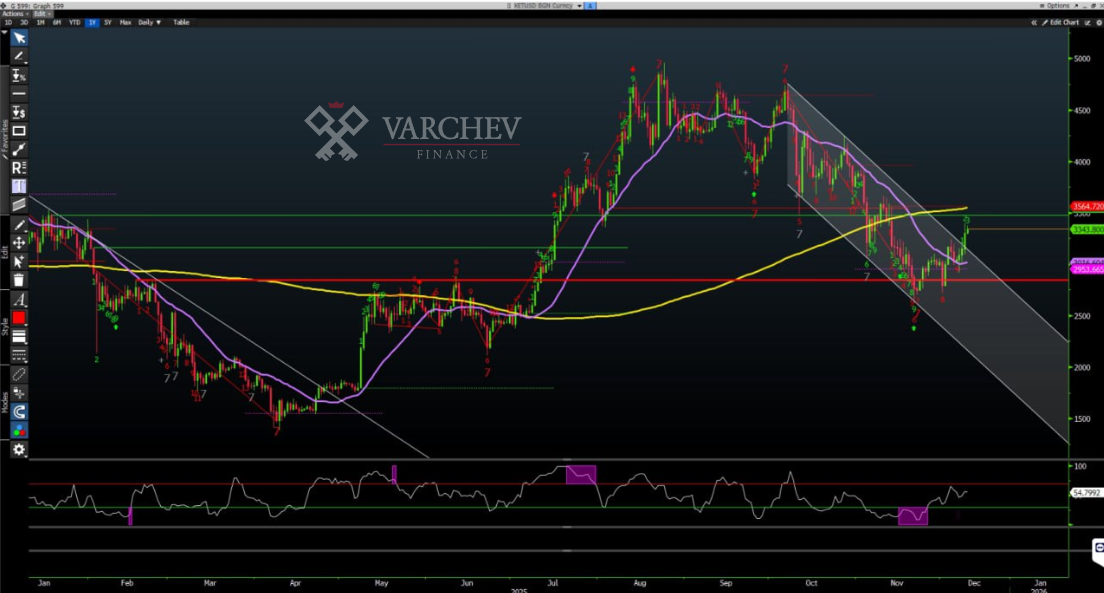
Was yesterday’s rally a bullish trap?
According to orderFlow Intel, investingLive’s proprietary AI-powered order flow analysis engine, the answer for now is “no.”
Ethereum scores +4 on a -10 to +10 sentiment scale:
-10 = extremely bearish
0 = neutral or indecisive
+10 = extremely bullish
A +4 clearly reflects bullish sentiment, supported by price structure, volume, and “under the hood” order flow patterns, while also accounting for potential volatility around tonight’s FOMC decision.
This article explains why the movement does not show classic signs of a bullish trap, why volume is stronger than expected, and which key levels traders should watch over the next 24–48 hours.
The analysis is educational and intended to support decision-making. It is not investment advice. Always trade at your own risk.
1. Market Context from December 1
Ethereum’s market structure is clear, progressive, and consistent with the ongoing bullish trend:
- December 1 – “Capitulation Drop”
Futures fell from ~3,060 to 2,728 under heavy selling pressure.
However, the close near 2,800 VWAP indicates significant absorption of buying. - December 2–3 – First Bullish Impulse
ETH recovered the 3,000 level and reached ~3,178.
This formed the first stage of the uptrend, supported by solid buying volume. - December 4–5 & 7–8 – Sideways Consolidation Base
Several sessions traded in a narrow 3,000–3,250 range, repeatedly rejecting moves below 3,000.
This created a structural base. - December 9 – Breakout Day
ETH jumped from ~3,125 to 3,409.
The price broke the 3,257 level and held above it.
The next target is 3,451.5.
By the early hours of December 10:
- Price held around 3,330–3,350
- Above yesterday’s VWAP (~3,277)
- Above yesterday’s POC (~3,335.5)
- Above the recovered “naked” level of 3,257
This is not typical behavior after a bullish trap, but shows the market is accepting higher value.
2. Volume Analysis – Checking Claims of Weak Volume
Some on social media claimed that yesterday’s rally had low volume.
The data shows the opposite:
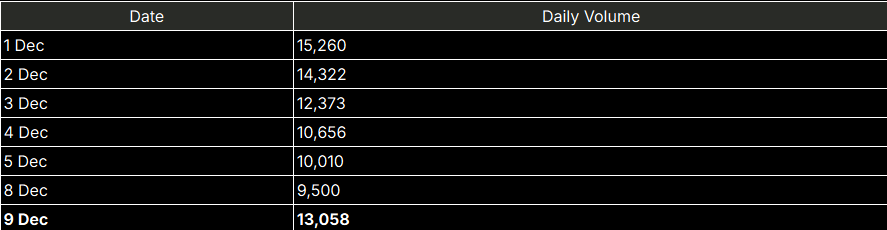
ChatGPT said:
- The December 9 rally occurred with higher volume than four of the last six sessions.
- This is not a sign of a bullish trap.
Classic signs of a bullish trap include:
- Breakout on low volume
- Climactic high volume but weak close with strong selling pressure
None of these are observed here.
3. What orderFlow Intel Sees “Under the Hood”
OrderFlow Intel analyzes:
- Aggressive buying vs. aggressive selling (delta)
- Buyer and seller behavior at highs and lows
- Volume cluster and acceptance zones
- VWAP dynamics
- Repeating behavior patterns detected by AI
Delta – simplified:
- Delta > 0 → more aggressive buyers
- Delta < 0 → more aggressive sellers
Delta in December:
- December 1: strong selling delta during the drop, but strong absorption at VWAP
- December 2–3: strong positive delta – real buyer aggression
- December 4–5: negative delta – seller counterattack
- December 8: positive delta – ETH recovers above 3,150
- December 9: moderate positive delta, buyers active at dips and highs, price closes above VWAP, no signs of exhaustion
If this were a bullish trap, we would have seen:
- Heavy selling delta at highs, or
- A strong positive delta spike followed by a weak close
None of this is present, so ETH receives +4 instead of a neutral or bearish rating.
4. Why Yesterday’s Move Is Not a Bullish Trap
- Volume supports the move: significantly higher than consolidation days
- Value is rising: ETH trades around POC, not below it
- Key technical levels hold:
- Above 3,257
- Above yesterday’s VWAP 3,277
- Above prior levels 3,221 and 3,150
- Order flow shows no distribution: no aggressive selling at highs, buyers remain active
Conclusion: the rally is structurally legitimate, not a bullish trap.
5. Key Levels for Traders
Upside:
- 3,409 – yesterday’s high
- 3,451.5 – next important level (“naked”)
Immediate Support:
- 3,335–3,350 – POC
- 3,277 – VWAP
Major Support Zone:
- 3,257 – recovered “naked” level
- 3,221–3,150 – deeper consolidation base
Bearish Reversal Warning:
- Close below 3,257 with heavy selling pressure and value drop signals breakout failure
6. FOMC: What Could Change in the Next 48 Hours
Bullish Scenario:
- ETH stays above 3,257–3,277
- Any dips are bought
- Value remains above 3,330
- ETH breaks 3,409 with strong order flow
Temporary Dip Before Recovery:
- Sharp swings in both directions
- Brief drop to 3,221–3,257
- Recovery above yesterday’s VWAP
True Bullish Trap:
- Spike to 3,451.5
- Reversal and daily close below 3,257
- Clear negative delta and high selling volume
- Rating would drop to neutral (0 to -2)
7. How to Use orderFlow Intel
OrderFlow Intel – led by Itai Levitan – turns institutional order flow analysis into a clear, actionable assessment.
+4 today means:
- Bullish structure
- Strong volume
- No signs of a trap
- High sensitivity to macro events
Traders can use this as a second opinion, especially if they lack access to advanced delta and volume analysis.
Final Thoughts and Ethereum Trader Warning Ahead of FOMC:
- Ethereum futures show no typical signs of a bullish trap
- Volume and order flow support the move
- Key levels hold
- With FOMC ahead, volatility risk is high
- The next 24–48 hours will determine whether ETH continues its upward trajectory or returns to lower levels
Varchev Absolute Trader
борсова платформа
- Търгувай над 3000 финансови инструмента: Crypto, Форекс, Акции, Индекси, Суровини, ETF-и
- Използвай платформа с директно изпращане ордерите на борсите
- Cloud base платформа - твоят трейдинг сетъп на всяко устройство
- Market Sentiment - търгувай с настроенията на инвестиционите банки
- Top movers - най-горещите трейдове във всеки един момент
- Stocks scanner - филтрирай най-подходящите за твоя трейдинг стил пазарни инструменти
- Heat map - Търгувай в посоката на големите играчи
Meta Trader 5
- Търгувай Crypto, Форекс, Акции, Индекси, Суровини - всичко на едно място
- Автоматизирана търговия с интелигентни стратегии и роботи (Expert Advisors)
- Разширен технически анализ с хиляди индикатора и инструменти
- Сигурност и стабилност – платформа, доверена от милиони по света
- Нулев марджин при насрещни/хеджирани позиции
- Без комисиона при търговия със CFDs
- Светкавично изпълнение на сделките
Read more:

Login to comment
Comments:
Leave a comment