


Rotation May Spiral on Policy Risks: Forecast for Large U.S. Companies to 2025
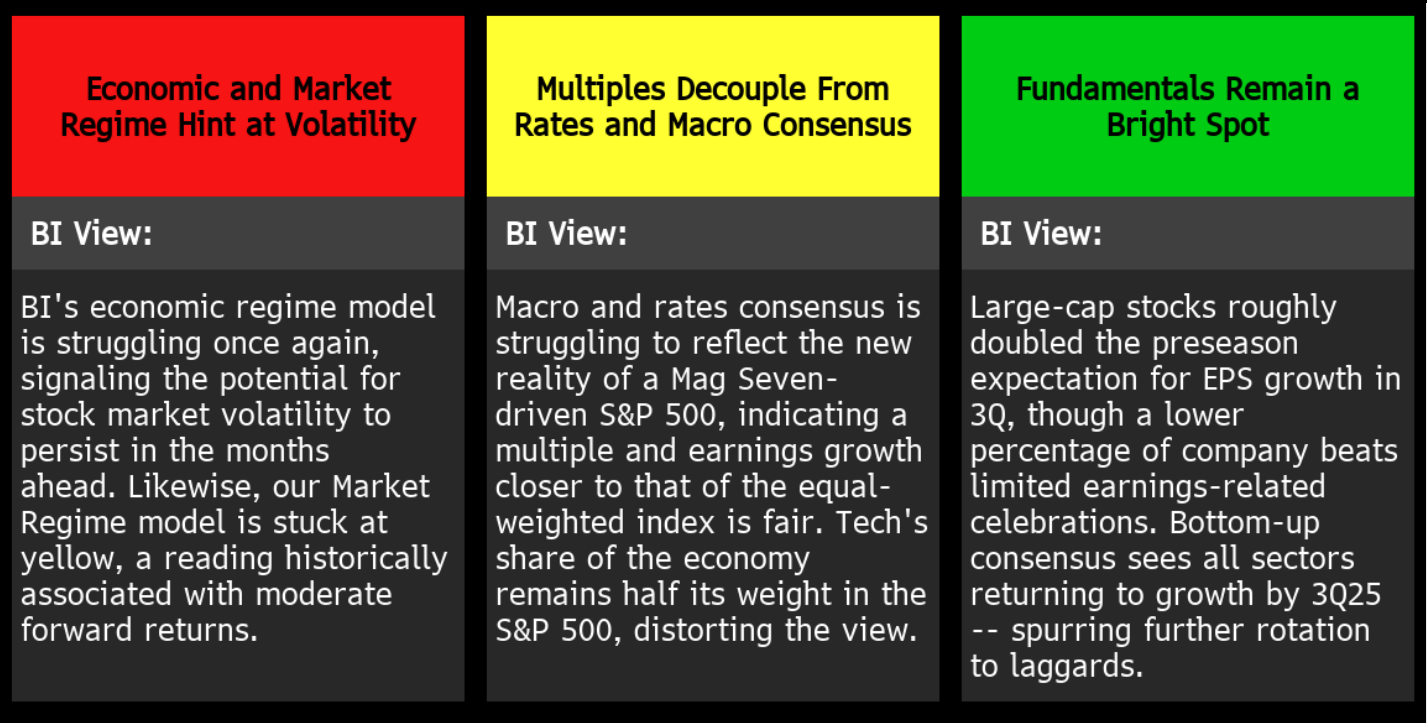
Fundamentals ignited what has become a major rotation in the second half of 2024, and Federal Reserve and fiscal policy decisions could strengthen new leadership while entrenching old leadership in 2025. The consensus expects earnings growth outside the traditional technology and communications leadership to almost completely level off next year, but the bar is being raised for all stocks. Similarly, our fair value model, based on consensus interest rates and macroeconomic forecasts, better reflects the bottom-up forecasts for the equally weighted S&P 500 than the underlying index, which reflects the high valuations and assumptions already invested in the multiples and growth of the Magnificent Seven. Healthcare, real estate, financials, and industrials lead our sector rotation model, with technology and communications notably absent from the top for the first time in three years.
1. Three Highlights for 2025: Large U.S. Companies
Key Factors
The U.S. stock market checklist suggests growth could slow in 2025.
A relatively encouraging earnings cycle and positive technical indicators could offset persistently weak economic signals that will hold back stock gains in early 2025, according to our Market Health Index, which covers 17 key indicators.
2. US market checklist loses some support in early 2025.
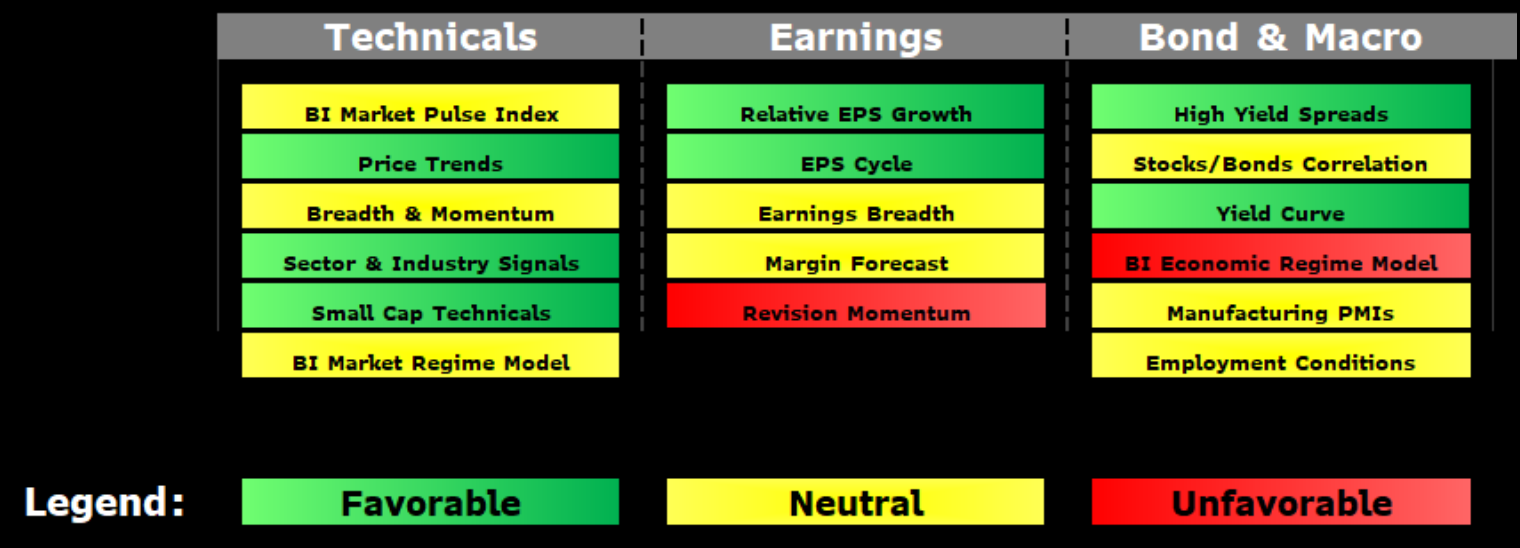
The fundamentals for US stocks remain solid but are starting to show small signs of cracking as 2025 approaches. Our latest Market Health Index summarizes the health of 17 current indicators across three categories — technicals, earnings trends, and bond/macro signals — and shows two red flags at this time, related to the momentum of revisions and our economic regime. There were no red flags in Q3. There are eight mixed (yellow) signals and seven clear (green) signals.
Technical indicators are less than ideal due to a shift in leadership to smaller-cap stocks, but the price trend remains very strong. Earnings indicators have weakened slightly due to more difficult comparisons and uncertain margin forecasts. Macroeconomic indicators remain clearly uncertain, as all signals in our economic regime model indicate fading momentum.
3. Fed Rate Cut Cycles Are Usually Good for Stocks
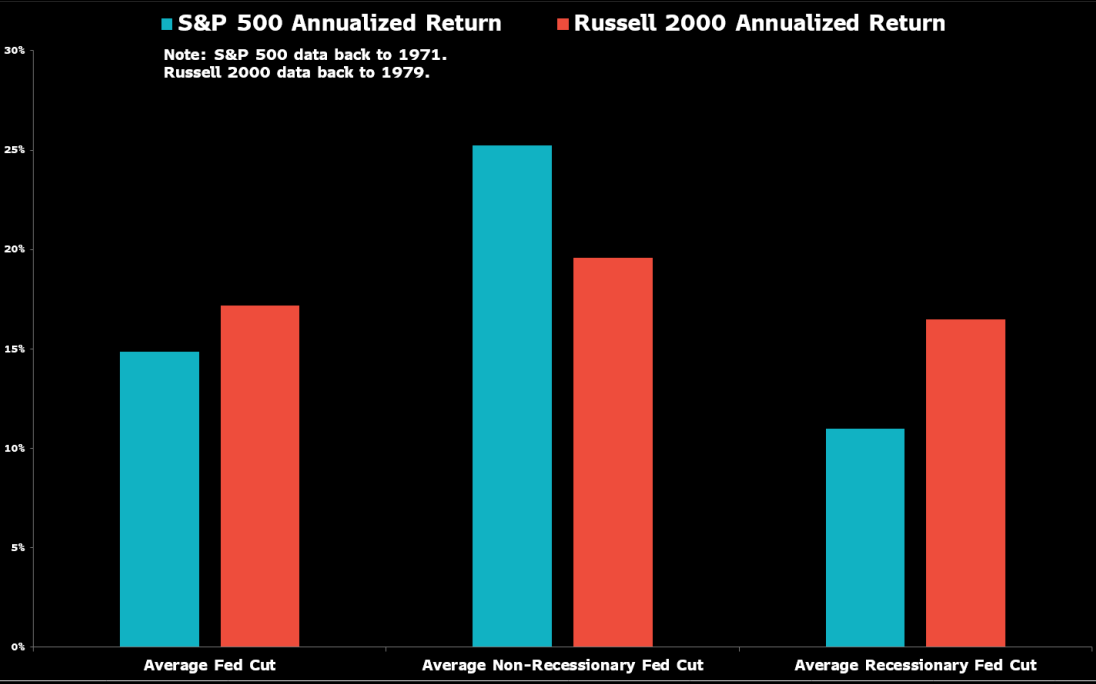
History suggests that a Fed easing cycle can offer steady support for stocks, especially when accompanied by strong economic conditions. Since 1971, the S&P 500 has returned 14.9% annually, and since the late 1970s, the Russell 2000 has returned 17.2% during periods when the central bank has cut interest rates.
The results are significantly stronger during interest rate cut cycles in non-recessionary periods: large companies report an average annual return of 25.2% compared to 11% in recessionary periods, while small companies reach 19.6% and 16.5%, respectively.
If the Federal Reserve ends easing early, the pace of growth for stocks is likely to depend more on the state of the economy. The S&P 500 reports an average return of 0% in the three months immediately following the end of easing cycles, but falls by 9.9% when the economy is in a recession, compared to 3.3% when it is not.
4. Dollar looks problematic for US multinationals
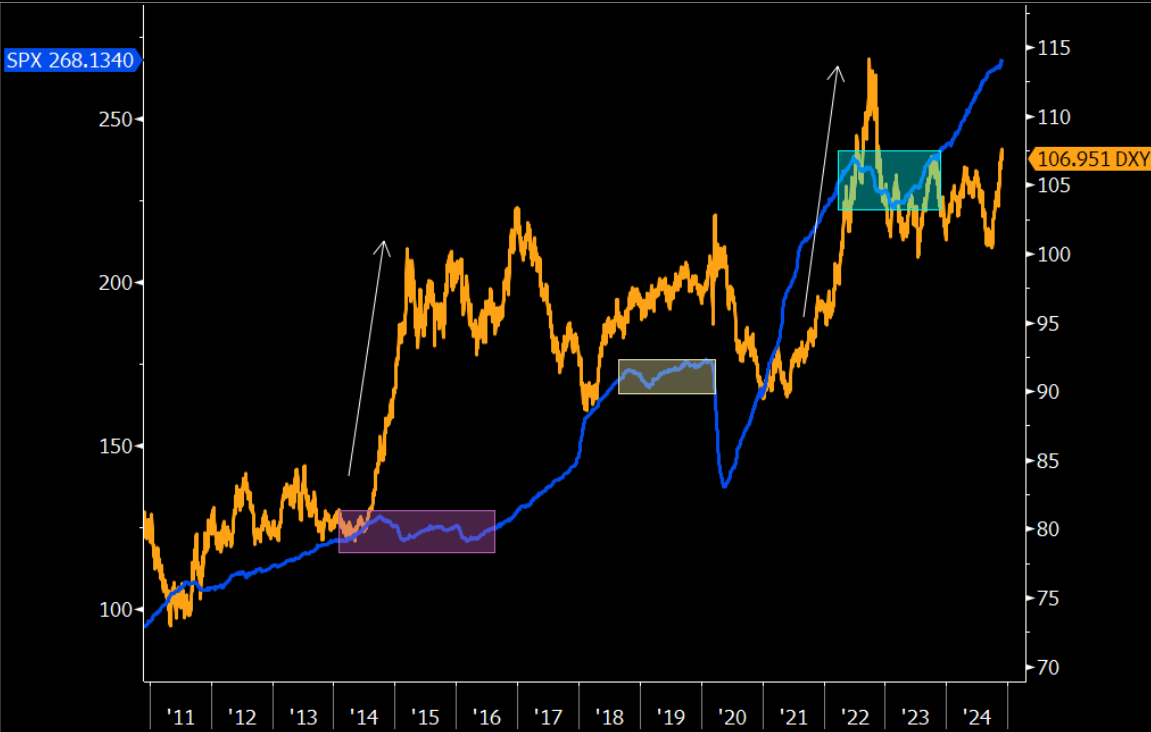
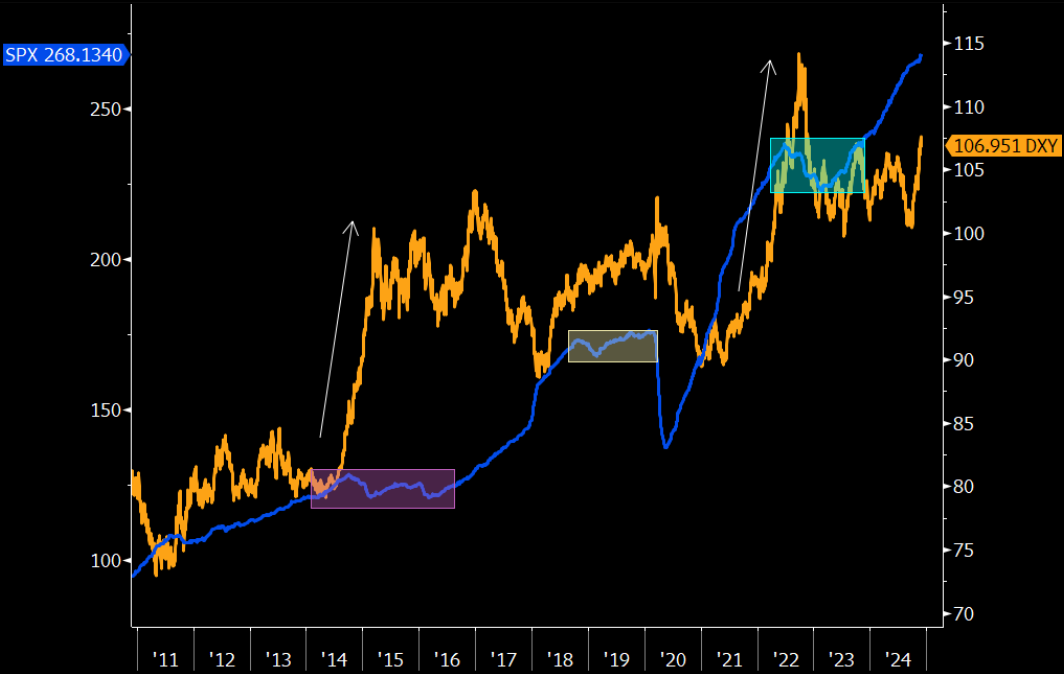
A strong dollar could offset some of the risk of tariffs squeezing importers’ margins in 2025, but it could also weigh on multinational stocks and slow earnings growth, given that this group contributes significantly to S&P 500 earnings. With the exception of 2020, every major dollar rally in the past 10 years has preceded a significant market correction.
Usually, dollar gains have to be significant before they affect earnings: the dollar has risen more than 25% since mid-2014. and by about the same percentage in 2021-22, both of which led to earnings recessions for the S&P 500.
Smaller currency gains were seen during Donald Trump’s first term, but a 10% rally amid tariff market shocks in early 2018 may have contributed to earnings volatility and the subsequent nearly 20% decline in stocks that year. The dollar has risen about 8% this year since its low on Sept. 27.
Magnificent Seven Ignore Model Showing Fair Value of S&P 500
Fair value modeling has a long-standing history of using macroeconomic data to determine the fair value of The S&P 500, however, has repeatedly underperformed stocks in recent years due to the outsized impact of mega-cap stocks. The equal-weighted index multiple is currently in line with our macro model projections, and analysts are only slightly more bullish on earnings growth than economists predict when the Magnificent Seven is eliminated.
Varchev Absolute Trader
борсова платформа
- Търгувай над 3000 финансови инструмента: Crypto, Форекс, Акции, Индекси, Суровини, ETF-и
- Използвай платформа с директно изпращане ордерите на борсите
- Cloud base платформа - твоят трейдинг сетъп на всяко устройство
- Market Sentiment - търгувай с настроенията на инвестиционите банки
- Top movers - най-горещите трейдове във всеки един момент
- Stocks scanner - филтрирай най-подходящите за твоя трейдинг стил пазарни инструменти
- Heat map - Търгувай в посоката на големите играчи
Meta Trader 5
- Търгувай Crypto, Форекс, Акции, Индекси, Суровини - всичко на едно място
- Автоматизирана търговия с интелигентни стратегии и роботи (Expert Advisors)
- Разширен технически анализ с хиляди индикатора и инструменти
- Сигурност и стабилност – платформа, доверена от милиони по света
- Нулев марджин при насрещни/хеджирани позиции
- Без комисиона при търговия със CFDs
- Светкавично изпълнение на сделките
Read more:

Login to comment
Comments:
Leave a comment