


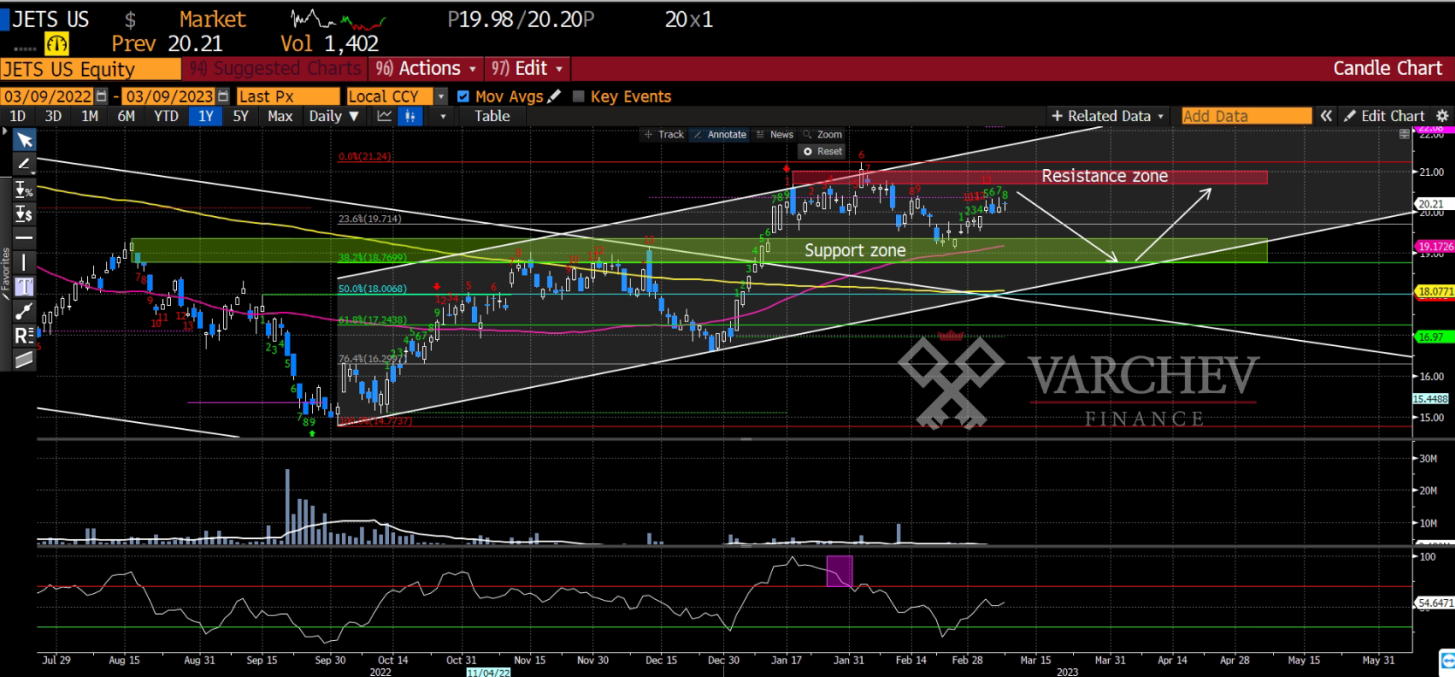
/The instrument can be traded on the Varchev Absolute Trader platform under the ticker JETS/
Not a recommendation for trade and investment.
This year is expected to be strong for air transport, following the opening of China. Airlines are increasing flight schedules and airports are hiring to handle increased demand. Summer is a strong season for the industry and this is likely to have a positive impact on earnings, especially after the weak period from Covid.
Of course, there are some headwinds to growth, specifically a shortage of aircraft engines and spare parts. For now, some airlines have been forced to ground hundreds of flights while they resolve the issue, but this is likely to be temporary. This headwind could provide good positioning levels for the sector in the long term.
Technical Analysis
1W Chart
The broken down channel and Inverse H&S are a good setup to position Long in the direction of the emerging trend. For now, price is retesting the non-klein of the H&S formation, which suggests upside momentum is coming from here, but I think because of the headwinds in the industry and the potential decline in the broader market, there could be some consolidation in the channel.
In the medium / long term, I expect to reach the levels around the 200 period, in the 22 – 23 zone, and on a break, quotes are likely to head for a test of the pre-Covid highs.

1D Chart
On the daily chart, the Sequential is nearing the end of an uptrend, suggesting that there could be another test of the 19.36 – 18.70 support. The range is likely to continue for some time until the outlook improves, but there is room for more upside in the long term.
DeMarker Oscillator, is in neutral territory, but is showing signs of strength through the sharp upward movement after reaching support.
I expect at least one more retracement to the 19.36 – 18.70 zone, where in the long term price looks cheap, supported by the technicals and fundamental long-term outlook.

Conclusion
Positioning Long in the zone 19.36 – 18.70 gives a good risk / reward ratio for the upcoming recovery in the industry. It expects the range to continue for some time, possibly until the diagonal support of the new ascending channel is reached.
Alternative scenario
A breakout of the ascending channel and a drop below the 19.36 – 18.70 area will signal weakness and a potential trade shift to lower levels. The stop loss zone is 17.89 – 17.48, outside the ascending channel and below the 200 period, measured against the size of the margin account.

 Dealer Anatoliy Pavlov
Varchev Absolute Trader
борсова платформа
- Търгувай над 3000 финансови инструмента: Crypto, Форекс, Акции, Индекси, Суровини, ETF-и
- Използвай платформа с директно изпращане ордерите на борсите
- Cloud base платформа - твоят трейдинг сетъп на всяко устройство
- Market Sentiment - търгувай с настроенията на инвестиционите банки
- Top movers - най-горещите трейдове във всеки един момент
- Stocks scanner - филтрирай най-подходящите за твоя трейдинг стил пазарни инструменти
- Heat map - Търгувай в посоката на големите играчи
Meta Trader 5
- Търгувай Crypto, Форекс, Акции, Индекси, Суровини - всичко на едно място
- Автоматизирана търговия с интелигентни стратегии и роботи (Expert Advisors)
- Разширен технически анализ с хиляди индикатора и инструменти
- Сигурност и стабилност – платформа, доверена от милиони по света
- Нулев марджин при насрещни/хеджирани позиции
- Без комисиона при търговия със CFDs
- Светкавично изпълнение на сделките
Read more:


Login to comment
Comments:
Leave a comment