


1.Stocks Are Flying. How Much Good News Is Left to Price In?
Stocks are enjoying the kind of backdrop investors dream about: a resilient economy, improving manufacturing activity and a bull market that refuses to quit. The problem is that markets are forward-looking. By the time ISM Manufacturing PMI reaches elevated levels, much of the good news is often already reflected in prices. PMI now sits at 54, approaching territory historically associated with weaker subsequent returns. At the same time, momentum is enjoying one of its strongest runs on record, with a trailing oneyear long/short return ranking in the 99th percentile since 1998. Investors may find that strong fundamentals alone are no longer enough to drive outsized gains.
2. Momentum Factor’s Historic Run in Large Caps Extends
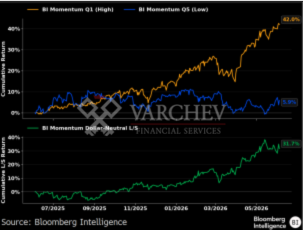
BI’s momentum factor continues to deliver exceptional results in US large caps. Over the trailing year, the long/short factor has returned 31.7%, driven by substantial outperformance from high momentum stocks. Since June 4, 2025, Q1 momentum names, defined as stocks with the strongest average six-month and 12-month returns excluding the most recent two weeks on a sector-neutral basis, have gained 42%, vs. 19.9% for the S&P 500 Equal Weight Index and just 5.9% for the lowestmomentum cohort. To put the 31.7% long/short return in perspective, it ranks in the 99th percentile of all overlapping 1-year momentum factor returns since 1998. BI momentum is constructed using equal-weighted, dollar-neutral Q1-Q5 portfolios within the S&P 500
3. Rising ISM Suggests More Good News May Be Priced Into Stock
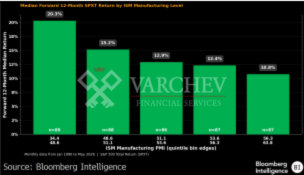
ISM Manufacturing PMI continues to improve, with the latest reading of 54 signaling a healthy manufacturing backdrop. In a bit of a counterintuitive result, we find that high PMI readings have historically been associated with weaker forward equity returns. Using monthly data since 1990, we sort PMI observations into quintiles and examine subsequent 12-month S&P 500 performance. The strongest returns follow weak PMI readings below 48.6, while the weakest occur after readings above 56.3. One explanation is that by the time PMI reaches elevated levels, much of the positive economic news is already reflected in stock prices. The current reading of 54 places the economy in the fourth quintile historically (53.6-56.3), suggesting limited incremental benefit from further economic strength.
4. Market Pulse Remains Firmly in ‘Manic’ as Risk Appetite Persists
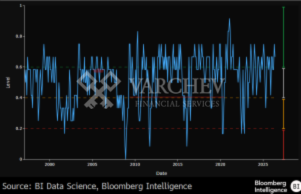
BI’s Market Pulse, our gauge of short-term market sentiment, remains firmly in manic territory. Three of the model’s six underlying components are currently contributing to the elevated reading: low pairwise stock correlations, persistent weakness in the low-volatility factor, and tight high-yield credit spreads. The remaining signals are more mixed. Market breadth and defensive-versus-cyclical sector performance are broadly neutral, while the recent outperformance of low leverage stocks over highleverage peers is consistent with a more cautious, “panic-like” reading.
5. Top List Includes Marvell, Bloom Energy and Flex
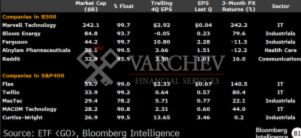
Our screens identify 10 companies with the strongest cases for S&P 500 inclusion, drawn from the Bloomberg US Large Cap Index (B500) and the S&P MidCap 400. All meet key requirements, including market capitalization, float-adjusted liquidity and profitability. Marvell Technology and Bloom Energy lead from the Bloomberg index, while Flex and Curtiss-Wright top the S&P 400. The group reflects both sector diversification and the market’s continued tilt toward AI and space-related themes. EchoStar’s recent inclusion stands out, as the company did not meet the profitability requirement and may have benefited from its stake in SpaceX. Of the six companies added since the latest rebalance, Vertiv and Veeva were drawn from the B500, while Lumentum, Coherent and Casey’s came from the S&P 400. FedEx Freight was spun off from FedEx.
6. Technology Dominates Small Caps as Breadth Broadens
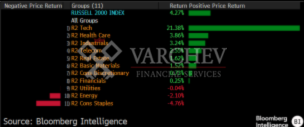
Technology’s dominance in May wasn’t limited to US large caps. It was also the primary driver of small-cap performance, with Russell 2000 Technology surging 21.38% on the month and accounting for much of the index’s 4.27% gain. Sector breadth was notably stronger in small caps than in large caps, however. While only three S&P 500 sectors finished higher, eight Russell 2000 sectors posted gains, led by Healthcare (3.86%), Industrials (3.24%) and Telecommunications (2.55%).
7.Strongest Earnings Growth Since 2022 Fueled by AI
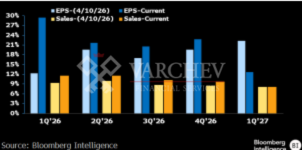
S&P 500 companies cleared an already elevated bar this earnings season, delivering strong upside surprises on both earnings and revenue, led in part by core AI companies. EPS growth reached 29.4%, more than double the 12.4% pre-season forecast (15% vs. 7.1% ex-AI), while revenue growth rose 11.6% vs. a 9.4% forecast (9.2% vs. 7% ex-AI), marking the strongest growth since 3Q22 for both. Despite upward estimate revisions, beat rates reached four-year highs, with 83.7% for EPS and 73.6% for revenue, versus five-year averages of 78.3% and 61.0%, respectively. Results closely matched our guidance model’s projection of top 20% EPS growth and 12% revenue growth. The core AI composite consists of 17 companies in our AI thematic basket with assessment scores of two or three at the end of 1Q26, including Nvidia, Broadcom and Micron.
8 .Value Stock Index Makes Chart Formation
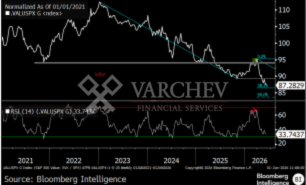
The S&P 500 Value Index (SVX), relative to its benchmark (SPX), is testing support, based on our chart. If the 2025 trough is decisively breached, a new all-time low would form that can extend to the 38.2% Fibonacci extension. The ratio would need to hold below the 2025 low for the drop to stay intact. That level – – which is support – – becomes resistance when pierced. Negative signs include closing below the 50-day and 200-day moving averages (DMA) and a bearish relative strength index (RSI) divergence formed as the ratio’s RSI hit a lower high while its price made a higher high. Also, the average drop of 1.2% in May on a trailing 10-year basis is concerning. Alternatively, a bounce off
this floor can reach the 200-DMA.
9.Japan Equity Momentum Challenges Sell-in-May Rule
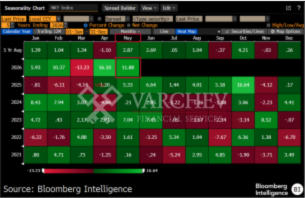
The “Sell in May” seasonal argument carries less weight in Japan when momentum is already strong. Over the past 50 years, the Nikkei’s median May-August return has been only 1%, but in years when May is positive, the median June-August return rises to 3.2% and increases to more than 13% when May gains exceed 5%, as they have this year. The conditional momentum backdrop is important given the Nikkei is already up 33% year-to-date in yen terms and 30% in dollar terms. Japanese large-cap equity indexes have meaningful exposure to AI infrastructure and data-center
spending among developed markets, particularly through semiconductors, technology hardware and capital goods. If global AI-capex momentum continues, Japanese equities may draw further support, with additional breadth from industrials and financials.
10. Latin America Has Lagged Behind the Global Equity Rally
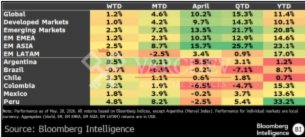
Optimism surrounding a potential agreement between the US and Iran helped lift global equities last week, while Latin American stocks underperformed both global and EM benchmarks. Brazil was the main drag, weighed down by lower oil prices as expectations for a normalization of flows through the Strait of Hormuz pressured energy stocks. Foreign investors are also set to record the largest monthly outflows since 2020, reversing a key source of support for Brazilian equities. Argentina continued to outperform as country risk fell amid improving domestic macro conditions, with international reserves reaching records. Colombian equities also advanced ahead of the first round presidential vote last week, as conservative candidate Abelardo de la Espriella gained momentum and prediction markets increasingly favored his chances.
11.Equity Risk-Premium Compression Signals Complacency
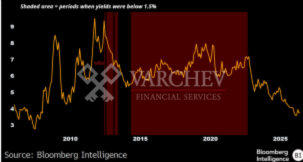
European equity valuations show a degree of complacency, with the Stoxx 600’s equity risk premium (ERP) down to its December 2007 level amid anticipations of a US-Iran deal and easing inflation improving earnings prospects. Higher bond yields — driven by energy-led inflation and political uncertainty (notably in the UK) — compressed the ERP to 370 bps, well below its 6.2% long-term median (5.4% when European 10Y yields were above 1.5%). The FTSE 100 shows a similar pattern, with its ERP falling near the mid-2007 lows and sitting 170 bps below its median during periods when 10Y gilt yields exceed 3%. History shows that when the ERP is in its lowest quintile, the median forward one-month return is just 0.9%, with positive returns 61% of the time. The best performance comes with the ERP in its middle
quintile.
12. Beverages Stay on Top; Distribution Slips Further on Momentum
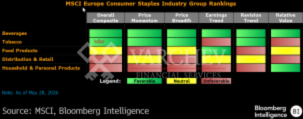
Our consumer staples scorecard shows little change at both ends, with beverages retaining the top spot and household & personal products staying at the bottom. Beverages remain supported by strong breadth, better growth prospects and attractive relative valuations, though Pernod Ricard’s guidance downgrade — tied to the Iran war — points to some earnings risk. Tobacco holds second place on strong price momentum and positive earnings revisions, yet screens as the most-expensive on a historical basis. Food products move toward the rankings’ middle ground on mixed fundamentals and weak price breadth. Household & personal products are still last, with weak results across all pillars, except valuation. Distribution products are lower on weak technicals and expensive valuations vs. others.
13. Korea and Taiwan Drive EM Higher
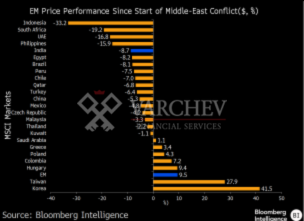
A record surge in AI-driven markets such as Korea and Taiwan has propelled the EM benchmark up 9% since the onset of the Middle East conflict in late February, resulting in Indian equities underperforming the region by nearly 18 percentage points. Excluding Korea and Taiwan, almost every major EM market has lagged the benchmark — a relatively rare occurrence. Elevated valuations in India have continued to deter foreign investors, triggering sustained outflows and weighing on equity market performance.
14. Southeast Asia’s Rating Cycle Since 2001
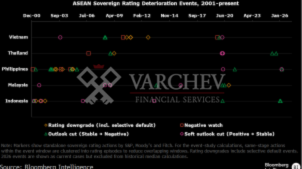
Southeast Asia’s rating risk is back in focus after Moody’s revised its Indonesia outlook to negative on Feb. 5, followed by Fitch on March 4, though both kept ratings at investment grade. The Jakarta Composite Index’s weakness suggests some concern is already priced in, though a broader risk-off since March clouds the signal. We assess whether a potential downgrade would trigger a fresh shock or merely confirm risks already absorbed, using Southeast Asian sovereign-rating deterioration events since 2001. The 1997-98 Asian Financial Crisis is excluded to avoid distortion. Events are grouped into rating downgrades, negative watch actions, stable-to-negative outlook cuts and positive-to stable revisions, with the impact assessed across equities and foreign flows.
15. Technology Joins Materials, Energy in Scorecard Lead
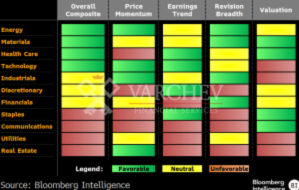
Our China equities sector scorecard keeps materials and energy in the top tier, with technology moving into the top bucket due to stronger price momentum and improving earnings. The shift may highlight the growing importance of the infrastructure and physical side of AI, with A-share tech benefiting from increased exposure to AI hardware. Materials is high due to authorities’ campaign against excessive competition and as commodity prices support momentum and earnings; cheaper valuations add to the score. Energy stays favorable as peace hopes haven’t erased the commodityrisk premium. Real estate and utilities stay at the bottom. Though real estate is the second-best performing sector year-to-date, supported by early signs of recovery in some tier-1 cities, weak earnings and valuations may suggest an L-shaped recovery path.
16. Tech Hardware Rally Sends EM Worries Packing
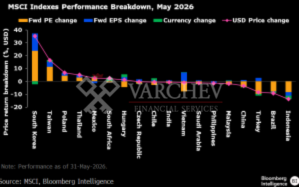
The tech hardware rally can keep powering emerging markets’ momentum, even with a US-Iran deal still elusive at the end of May. While earnings revisions are still positive for the two tech-heavy markets, valuation reratings contributed more to last month’s gains after the curtain fell on 1Q’s results. Yet, outside of tech, valuation changes have been mixed, which highlights the diverging paths of markets that boast strong tech exposure, and those that don’t. It might take a lasting resolution to the Middle East conflict, and the Strait of Hormuz reopening, for valuations to show broad
improvement across all emerging markets. We calculate the breakdown of each market’s return using price-performance data and 12-month blended forward BEst price-to-earnings ratios for individual MSCI market indexes.
17 .Record-Low Beta Deepens EM Value Drawdown
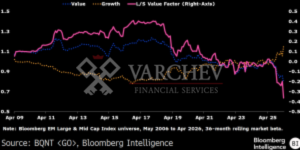
Value’s recent drawdown is partly explained by its large negative market exposure. For most of the past five years, value and growth stocks had similar market sensitivity, with betas fluctuating around1. But this began to diverge late last year: value stocks became less sensitive to the market, with beta falling below 1, while growth stocks’ beta moved higher. Currently, value’s beta stands at 0.79, versus 1.15 for growth, implying a long-short value factor beta of minus 0.36 — calculated as the difference between the two — which stands at a record low. This deeply negative net beta means that an explosive, growth-driven market rally inherently acts as a severe structural headwind for the value factor
18. Factor ETFs Are Actually Working Again
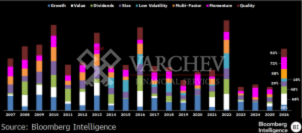
Factor ETFs are quietly having a moment. Nearly 50% of all smart beta ETFs are outperforming the broader market this year — a surprisingly strong showing given how powerful the overall equity rally has been. Historically, the highest factor ETF beat rates came in 2022, when defensive positioning and a focus on fundamentals helped during a brutal market environment. That makes this year especially notable: it’s rare to see such widespread factor outperformance during a strong up market. Looking across categories, value, multifactor, momentum and quality ETFs all have more than half of ETFs beating the market, suggesting leadership is finally broadening beyond just the largest tech
names. The resurgence also comes after an unusually difficult stretch for factor investing, with 2023 and
2025 ranking among the weakest years.
19. Software ETF Makes Chart Formation
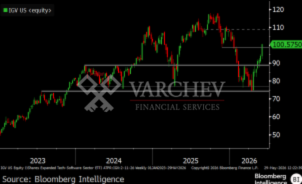
The software sector ETF may remain in a trading range in the near term, based on our chart. This channel is defined by February 2024’s high as resistance and July 2023’s peak as support. Rebounds and pullbacks from these prices reinforce them as key levels. Staying within this floor and ceiling on a closing basis suggests the downtrend has stalled, and a trading range can stay in place. Closing below this floor may reach October 2023’s low. On the flip side, piercing resistance can extend to November’s trough. Positives are that it closed above the 50-day moving average and posted the largest consecutive months of inflows in the past 10 years. This comes after IGV’s failed breakdown below January 2024’s trough, as it closed back above this level the following week.
20. Oil Services ETF Generates Chart Formation
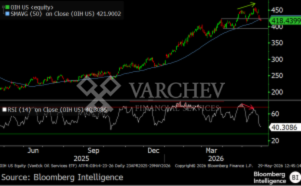
The VanEck Oil Services ETF (OIH US) may rally more, based on our chart. A close above March’s high can extend the rally to the peak for the week ended Aug. 3, 2018. OIH formed a bearish engulfing pattern on March 30, as it opened near the high and then fell to close near the low; thus, its high/low range is wide, and the previous day’s candlestick fits within its open/close range. A negative is the bearish relative strength index (RSI) divergence. The ETF’s RSI didn’t form a new high for 2026 while its price made a higher high, so the breakout may stall. Also, its short interest — near a 10-year low — may become a source of selling pressure, and March outflows were the most since May 2022. A close back below March’s peak can extend to the 50-day moving average.
21. Sustainable ETF Flows Favor Less Explicit Branding
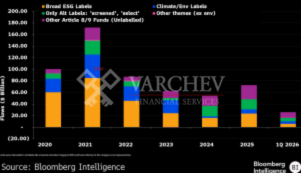
Sustainability-related ETFs were resilient in 1Q, attracting over $20 billion, with flows concentrated in unlabeled Article 8/9 ETFs rather than those specifically labeled sustainable or climate-branded products. Funds using softer sustainability language such as “screened” labels that typically refer to
exclusions also gathered assets. That contrasts with the broader sustainability-fund universe, where “screened” strategies were a key source of outflows in 2025, suggesting ETF demand is holding up best in products with sustainability characteristics but less explicit branding. We cover funds labeled ESG, sustainability, climate, values-based or impact, along with SFDR Article 8 and 9 funds. Blackrock, Credit Agricole, UBS and BNP Paribas are among managers seeing the largest inflows.
22. The ETF Launch Boom Rolls On
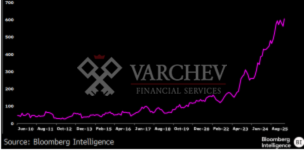
The ETF industry’s launch boom has reached unprecedented levels. More than 600 new US exchange-traded funds have come to market over the past six months alone, a record pace that accounts for more than 12% of the industry’s roughly 5,200 products. The surge has reshaped the competitive landscape: nearly half of all ETFs currently trading are less than three years old. Although the flood of launches reflects issuers’ efforts to capitalize on investors’ appetite for new strategies, it also raises the stakes in an increasingly crowded market where many funds may struggle to gather assets and reach scale.
23. QQQ Is the Top Fee-Generating ETF Out of Over 5,000 Products
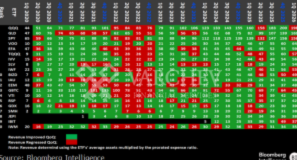
The Invesco QQQ Trust Series 1 may be the most valuable ETF franchise in asset management. Not because it has the most assets, but because of how much fee revenue it extracts from those assets. In 1Q, QQQ generated an estimated $198 million, much larger than peers like SPY and far above ultralow-cost competitors such as VOO and IVV. What makes QQQ remarkable is that it continues to command premium pricing in an industry defined by fee compression. The two keys here are that Invesco has had this index to itself, and the index is such a potent performer. Investors see it as lowcost despite VOO being cheaper, given the next-level performance. While some mutual funds generate more revenue, QQQ is more valuable because ETFs are growing while mutual funds are dying.
24. Software’s Rally Puts CLOD at Top of Our ETF Leaderboard
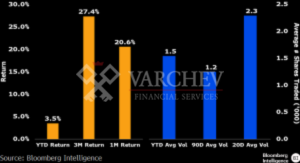
The Themes Cloud Computing ETF (CLOD) is showing real signs of breaking away from the pack with a return of 20.6% during the month of May and a 48% jump in volume- which is part of our quantitative process for deciding on our ETF of the month. The gain tracked a broader rebound in software and helped the fund’s concentrated 50-security portfolio outperform broader benchmarks.
Software has been one of the sectors many have said is most vulnerable to AI, but the market is not buying it, as the May rebound has been sizable, bringing the sector back above water for the year. CLOD’s volume is up, but it is still relatively small at half a million; we’ve seen this story many times before, as these little early jumps tend to portend long-term viability for an ETF.
25. JPM and DFA Combined Could Rule Active ETF Market for Long Time
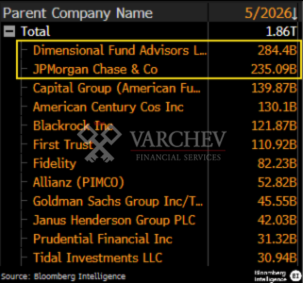
Dimensional would make for an attractive acquisition target for a deep-pocketed global asset manager looking to grow its active ETF business. The private firm is reportedly looking for a buyer, according to trade publication CityWire. One suitor we think would make sense is JPMorgan, given their similar yet complementary ETF brands. Both firms have found success with low-cost active ETFs, albeit for different reasons. Much of JPMorgan’s flow has been into covered call ETFs and fixed income, while DFA is known as an expert in factor investing.
The active ETF market is arguably the hottest real estate on Wall Street because it is growing rapidly, and managers can earn more fee revenue than with index funds. The potential acquisition would give JPMorgan $519 billion in active ETF assets — nearly 4x any other issuer.
26. Weak Economic Data Keeping a Lid on Front End Yields
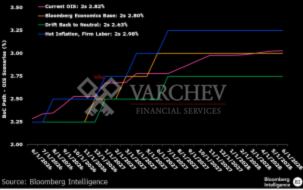
A series of weak economic releases have repriced the Bank of Canada’s policy path, moving 2-year yields back in line with our near-term forecasts of 2.8%, limiting further bull-steepening absent additional data deterioration. The BoC’s implied hiking cycle was rather aggressive given domestic fundamentals, pricing in a 2.75% and 3.25% policy rate by year-end 2026 and 2027, respectively. The recent rally has brought the front end of the curve back in line with fair value under Bloomberg Economics’ forecast for quarterly rate hikes back to neutral territory beginning in December 2026. Risks are skewed to the downside, with a soft and increasingly sticky economic outlook and the CORRA curve still pricing a 3% terminal ceiling, about 25 bps above median neutral-rate estimates.
27. US Aggregate Rises 0.31% in May, Underperforms Coupon Returns
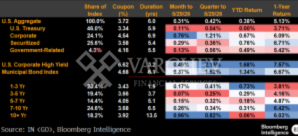
Fixed-income indexes saw mixed performance in May, with the Treasury Index limping into monthend, returning just 11 bps vs. the corporate index’s 76 bps of total return and 56 bps of excess return. The Aggregate Index posted a relatively modest 31 bps total return as headline volatility surrounding the Iran war dominated trading. Reports of progress in negotiations after midmonth supported longend Treasuries, leading to a sharp bull flattening of the yield curve that pulled 30-year yields back below 5%. Despite some declines in TIPS breakeven inflation, real yields drove much of the move across the curve, with the TIPS Index slightly outperforming its nominal counterpart. Cross-asset excess returns were solid, with a late-month ceasefire announcement helping ease volatility.
28. Debt Stock Is Increasingly Negative for Yields
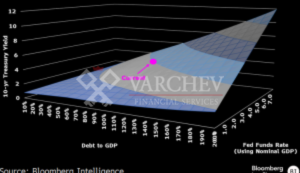
The continued increase in the amount of government debt outstanding may further shift pricing dynamics for any given level of economic activity. Later, we discuss how we apply a simple model of the 10-year Treasury yield. With marketable debt to GDP at about 100%, we think we’re at a point where Treasury market rallies will be shallower and selloffs more pronounced — though the market will remain cyclical with the economy. We use the quarterly model described below and add debt to GDP as a stock variable. We model the debt effect using other developed markets as examples, with the difference of French and German 10-year yields compared with their debt stock. The advantage of this is that both countries’ debt is priced in the same currency, yet they have different perceived credit risks.
29. Deficits Have Stabilized, Yet Still Large
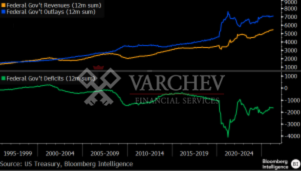
The federal government deficit looks to remain close to $2 trillion per year. The risk is for somewhat wider deficits if the economy flounders, and by extension tax receipts decline. Given that it’s likely there will be split government come early 2027, we don’t think a large fiscal response to any economic slowdown is likely, meaning there’s potential for a more prolonged slowdown — but also only modestly higher deficits driven by the revenue side of the government’s finances. Spending reductions in aggregate are unlikely, as the last of the baby boom generation starts to
collect Social Security and Medicare, further increasing mandatory spending and further reducing congressional fiscal flexibility.
30. Year-End US Rates Scenarios
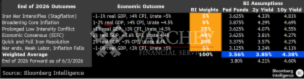
Uncertainty is a term that’s been used quite often since the start of the Iran war, with headlines shifting market pricing in rate markets — moving dramatically lower when it seems like the war will end quickly, then completely reversing when peace talks stall. With all of this happening within relatively well-defined ranges in recent weeks for the 2- and 10-year Treasury. The long end has different dynamics, which we’ll discuss briefly later in this note. We see broadly six realistic scenarios over the remainder of the year — the scariest of which for the economy and rates markets is an intensification of the Iran war. On the other extreme, an end of the war yet a weak labor market could move the economy to near recessionary levels. These are the tail events, with economic consensus most likely
Varchev Absolute Trader
борсова платформа
- Търгувай над 3000 финансови инструмента: Crypto, Форекс, Акции, Индекси, Суровини, ETF-и
- Използвай платформа с директно изпращане ордерите на борсите
- Cloud base платформа - твоят трейдинг сетъп на всяко устройство
- Market Sentiment - търгувай с настроенията на инвестиционите банки
- Top movers - най-горещите трейдове във всеки един момент
- Stocks scanner - филтрирай най-подходящите за твоя трейдинг стил пазарни инструменти
- Heat map - Търгувай в посоката на големите играчи
Meta Trader 5
- Търгувай Crypto, Форекс, Акции, Индекси, Суровини - всичко на едно място
- Автоматизирана търговия с интелигентни стратегии и роботи (Expert Advisors)
- Разширен технически анализ с хиляди индикатора и инструменти
- Сигурност и стабилност – платформа, доверена от милиони по света
- Нулев марджин при насрещни/хеджирани позиции
- Без комисиона при търговия със CFDs
- Светкавично изпълнение на сделките
Read more:

Login to comment
Comments:
Leave a comment