


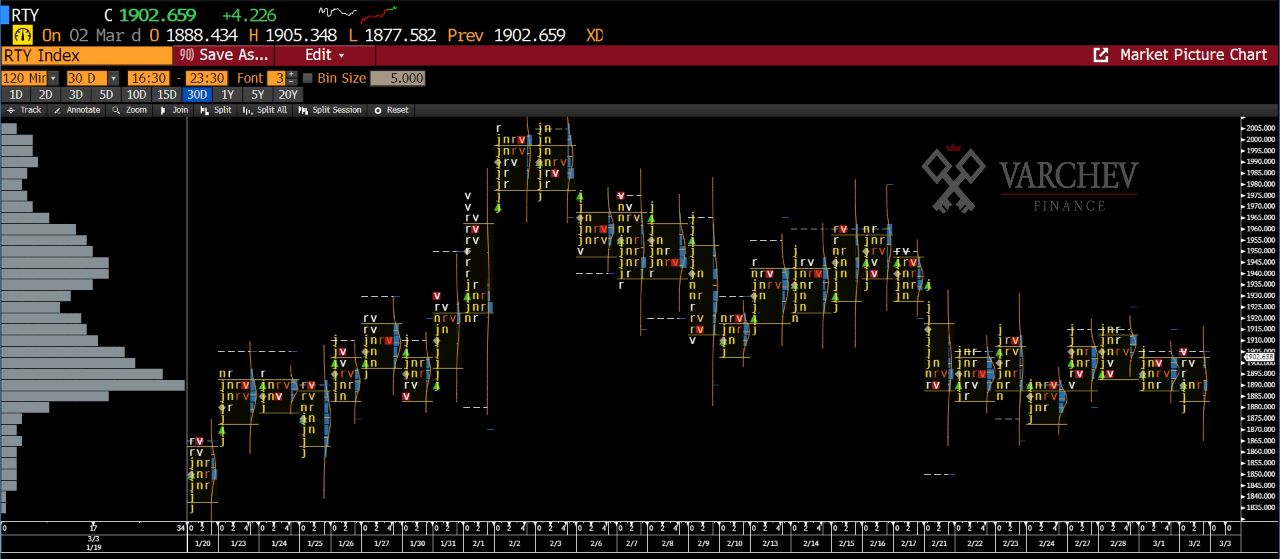
/ SP500 and Russel 2000 (US2000) are available for trading on the Varchev Absolute Trader platform. The article is not a trade recommendation. /
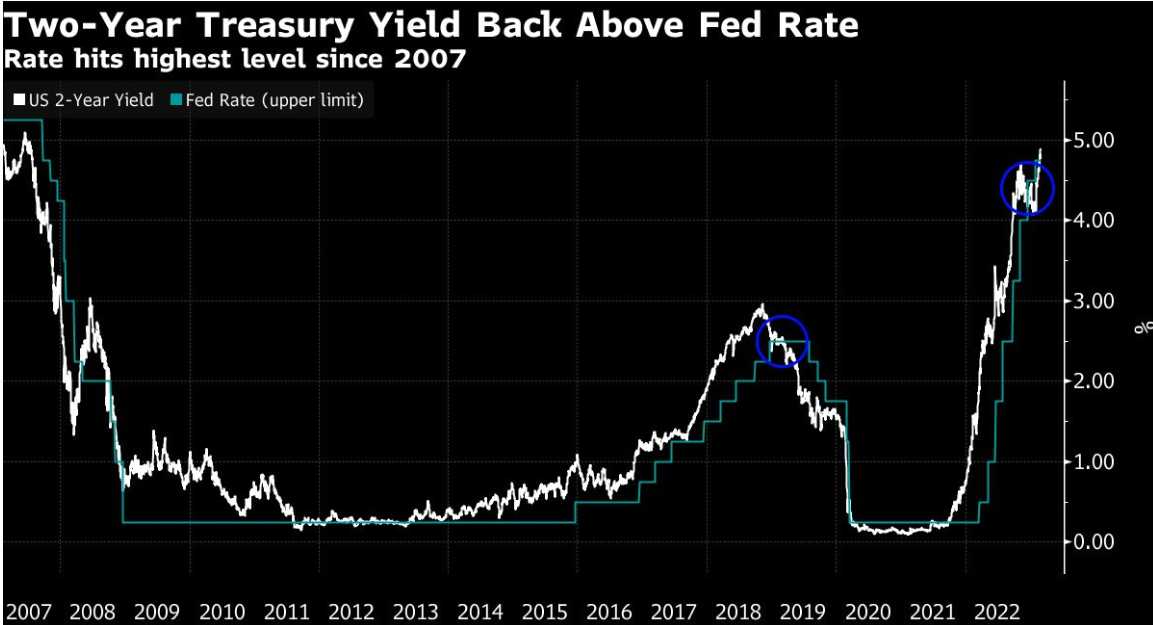
Fundamentals have changed over the past month in the US, along with QT and expectations of a decline in EPS this year, recent weeks have also brought data suggesting a continuation of the Fed’s hawkish policy beyond May. 2-year Treasury yields are once again above the Fed’s range, meaning a peak is not yet on the horizon.
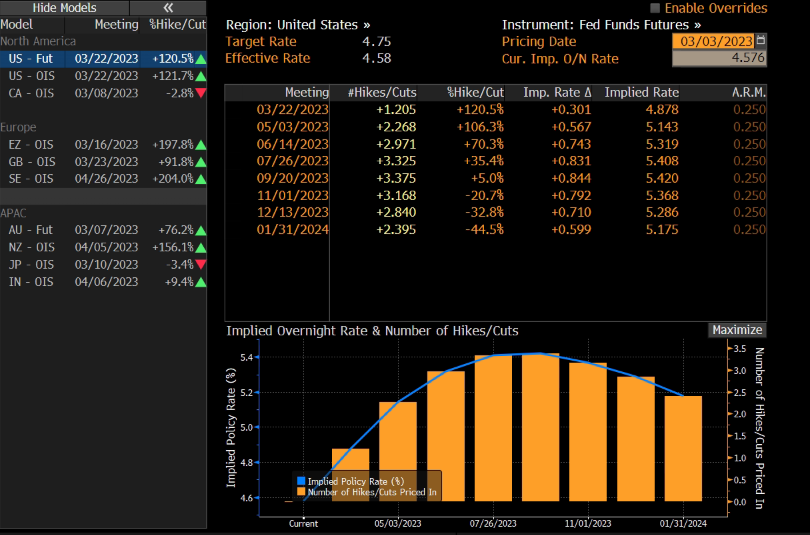
Futures markets expect rates to peak at 5.4% in the summer, and that reassessment has been at the heart of the selloff in recent weeks.
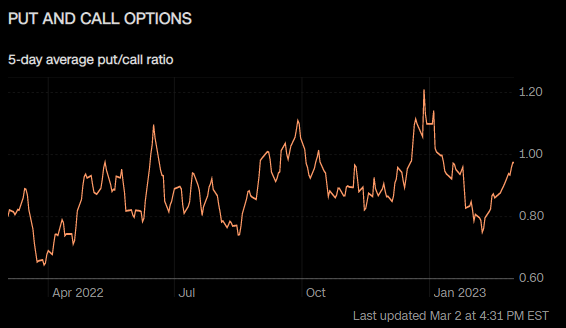
These fundamentals cast doubt on the longer-term upside potential for US indices, but in the short-term the data has already been reflected and the options market is showing a reverse signal. SP500’s Put/Call ratio is close to 1.00.
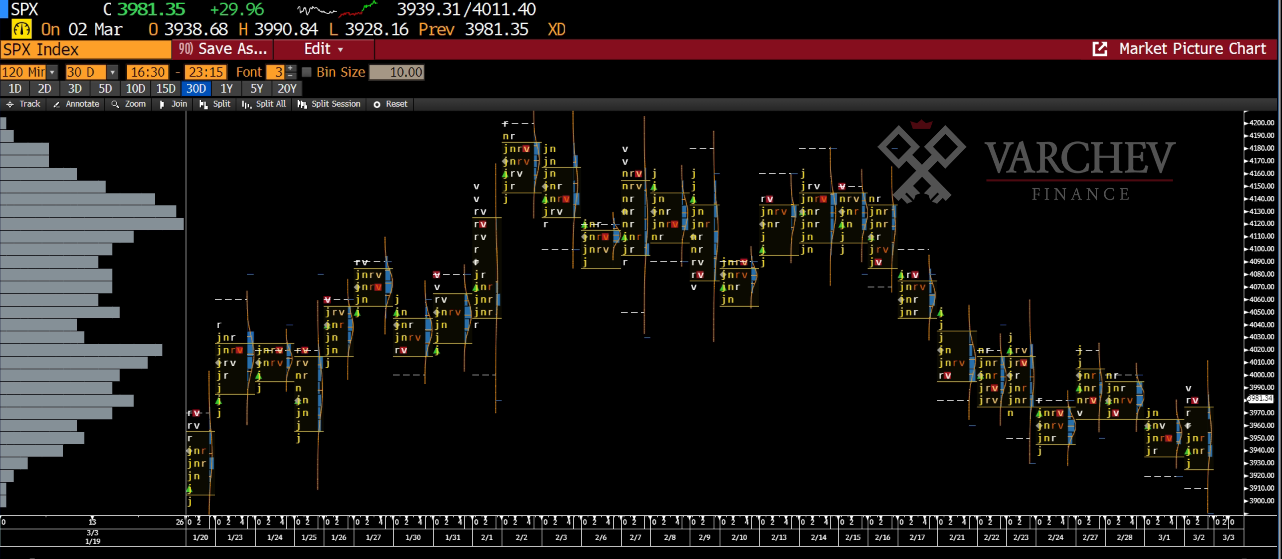
Short Term Market Profile SP500
The market profile of the last 30 days of the broad index shows an increase in volumes in the 4000 – 4200 area, which means that on a rise to these levels the transition may be difficult and an initial return to the Value area will follow, the other increase, which can be a potential resistance is in the zone 4120 – 4140.
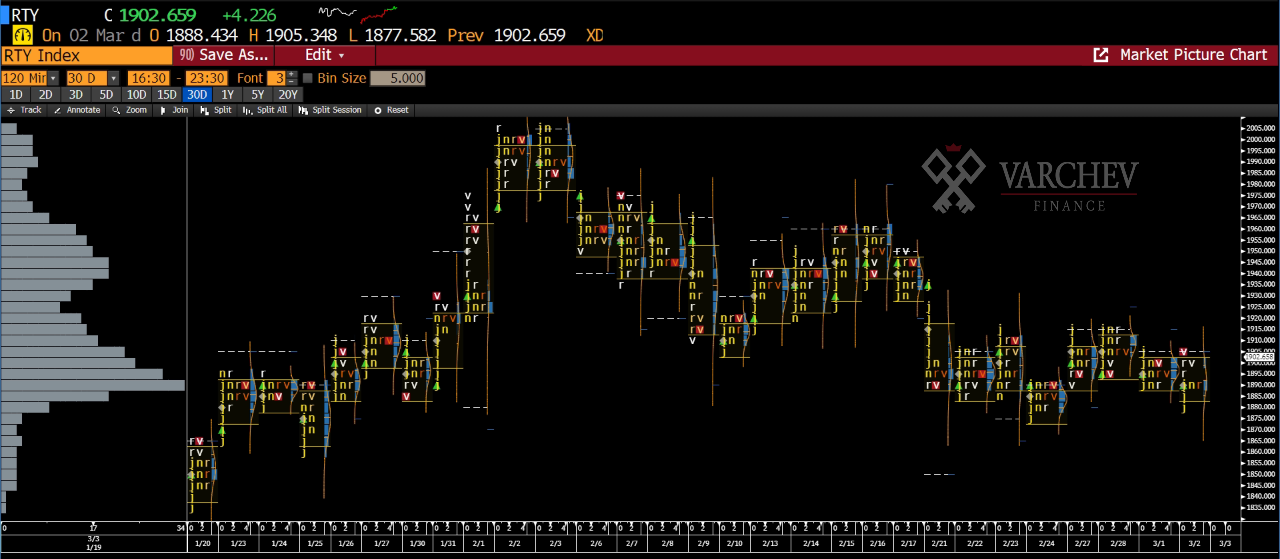
Short Term Market Profile Russel 2000
For the index of companies with small market capitalization, the volumes of the last 30 days show a slightly different picture. The strongest increase is in the lower part of the Value area 1880 – 1890, which suggests that with a new descent the price will move significantly slower and harder and the area is a potential support. Above the Value area, volumes are low all the way to the 1940 – 1960 zone, which means the move up may be without significant resistance until 1940 – 1960.
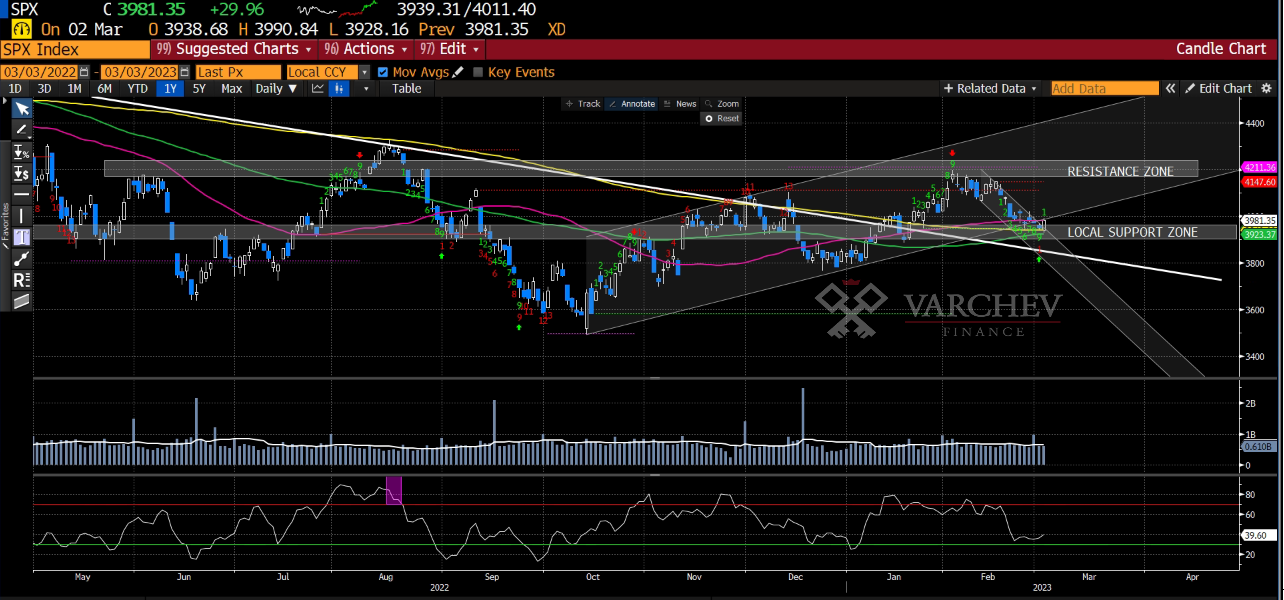
Technical Picture
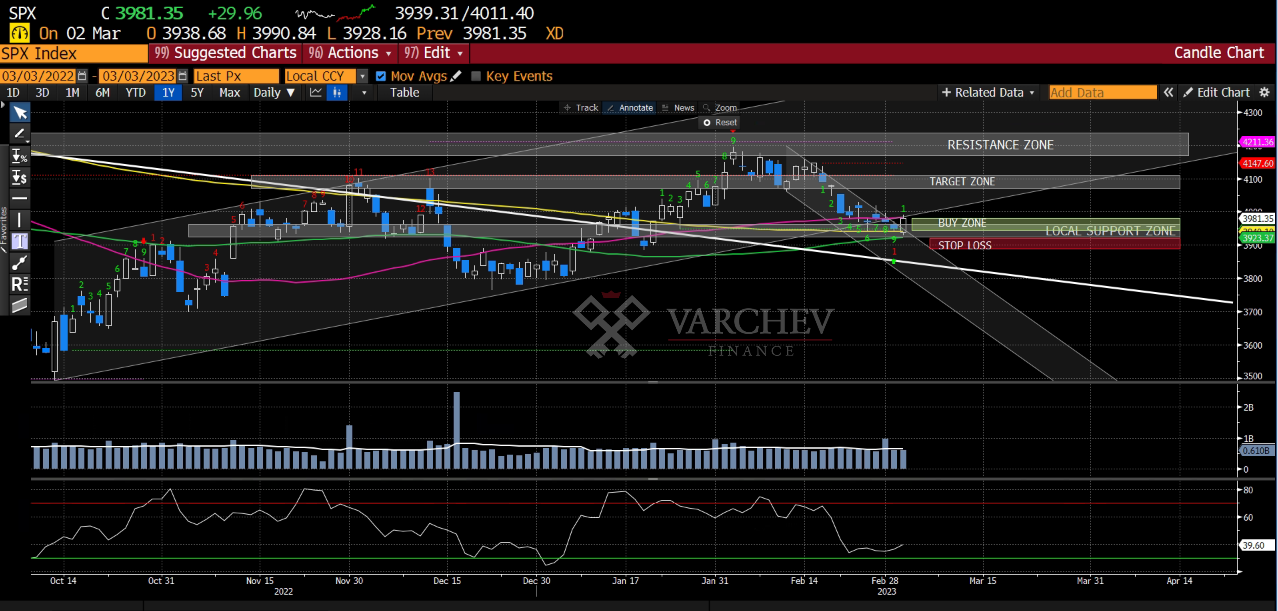
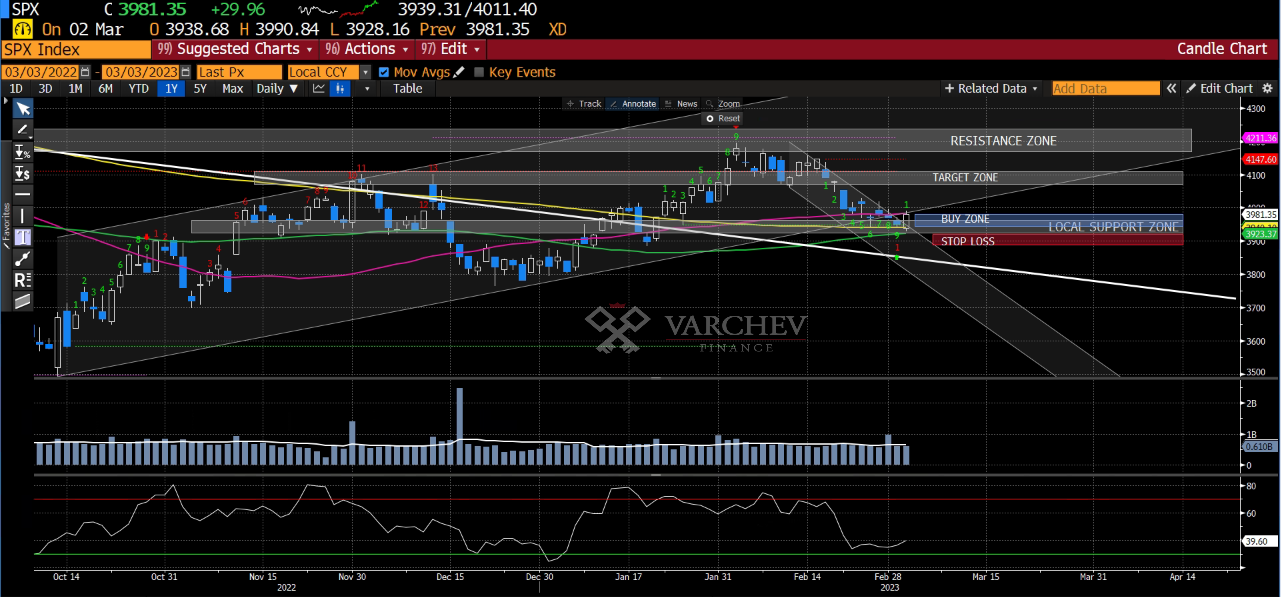
Price action is with a reverse signal from the local support and 200MA, Sequential is with a confirmed 9 and a new count up begins, DeMarker failed to enter oversold during the decline – a sign of lack of strength and is currently reversing. Despite the breakout of the ascending channel, I expect the development of an upward movement, but I want to note that it is most likely that the price will register a lower peak than the previous one. A potential target is the zone 4080 – 4120.
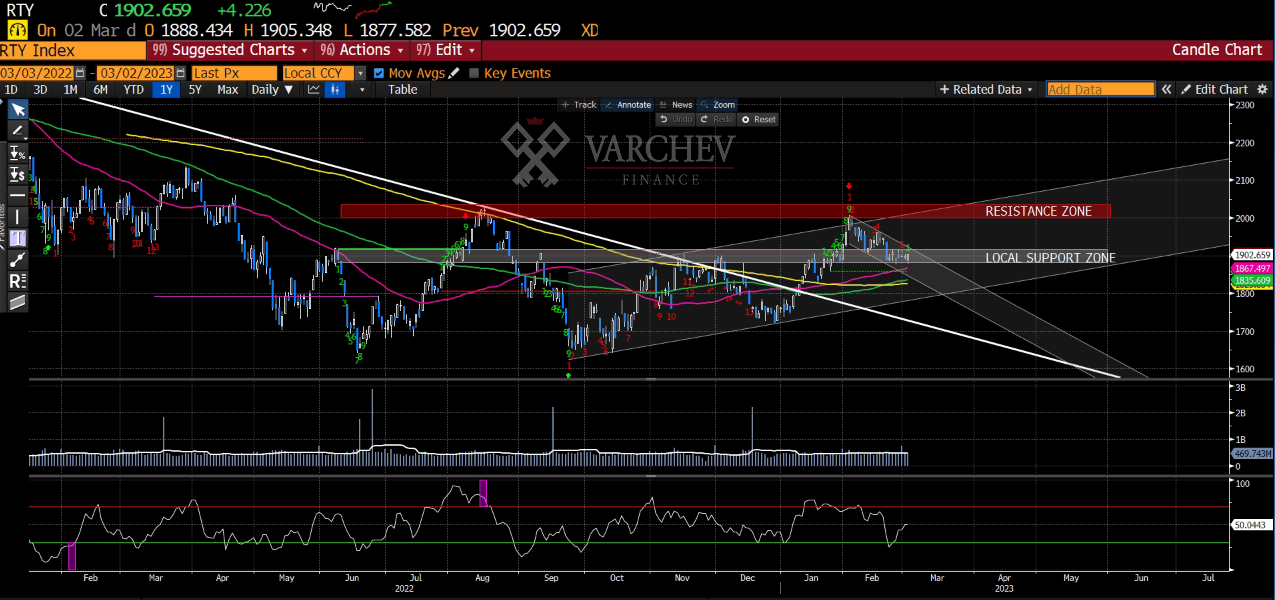
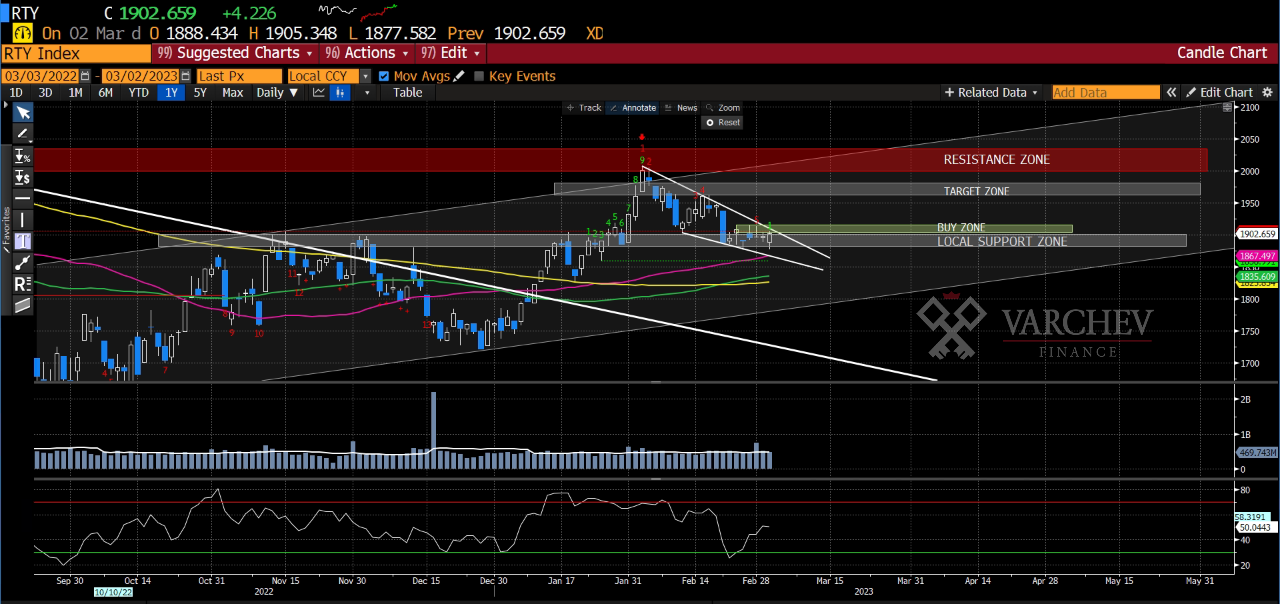
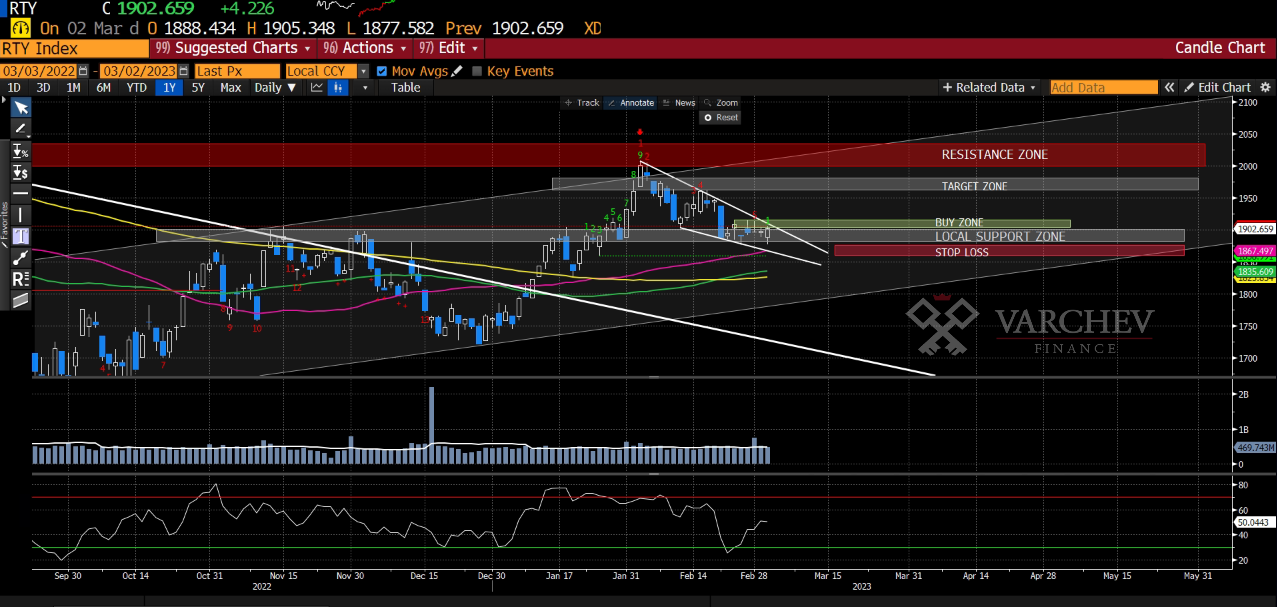
The Russell performs better during the downturn, the US indices are generally closely correlated and the divergences are usually around the bottoms and tops. And here the price action shows a potential reversal from the local support, which also coincides with the area with increased volumes. My expectations are for a rise to the 1950 – 1980 zone.
Conclusion:
The long position can be split between the two indices for better diversification of the trade itself and a more defensive part entry.
For SP500 buy on a potential pullback to the 3950 – 3970 zone with a potential target of 4080 – 4120.
For Russell buy at the close of the descending corrective channel with a potential target of 1950 – 1980.
Alternative scenario:
Closing on a daily basis below the local support zone means the potential development of a new downward wave and a test of the key support around 3800. The appropriate stop loss is below the local support zone (3920-3950), measured against the size of the margin account.
A break to the upside and then a close below the local support zone will open up the potential for a downside continuation here. Stop loss is below the zone 1880 – 1890, measured against the size of the margin account.
 Dealer Radoslav Valov
Varchev Absolute Trader
борсова платформа
- Търгувай над 3000 финансови инструмента: Crypto, Форекс, Акции, Индекси, Суровини, ETF-и
- Използвай платформа с директно изпращане ордерите на борсите
- Cloud base платформа - твоят трейдинг сетъп на всяко устройство
- Market Sentiment - търгувай с настроенията на инвестиционите банки
- Top movers - най-горещите трейдове във всеки един момент
- Stocks scanner - филтрирай най-подходящите за твоя трейдинг стил пазарни инструменти
- Heat map - Търгувай в посоката на големите играчи
Meta Trader 5
- Търгувай Crypto, Форекс, Акции, Индекси, Суровини - всичко на едно място
- Автоматизирана търговия с интелигентни стратегии и роботи (Expert Advisors)
- Разширен технически анализ с хиляди индикатора и инструменти
- Сигурност и стабилност – платформа, доверена от милиони по света
- Нулев марджин при насрещни/хеджирани позиции
- Без комисиона при търговия със CFDs
- Светкавично изпълнение на сделките
Read more:


Login to comment
Comments:
Leave a comment