


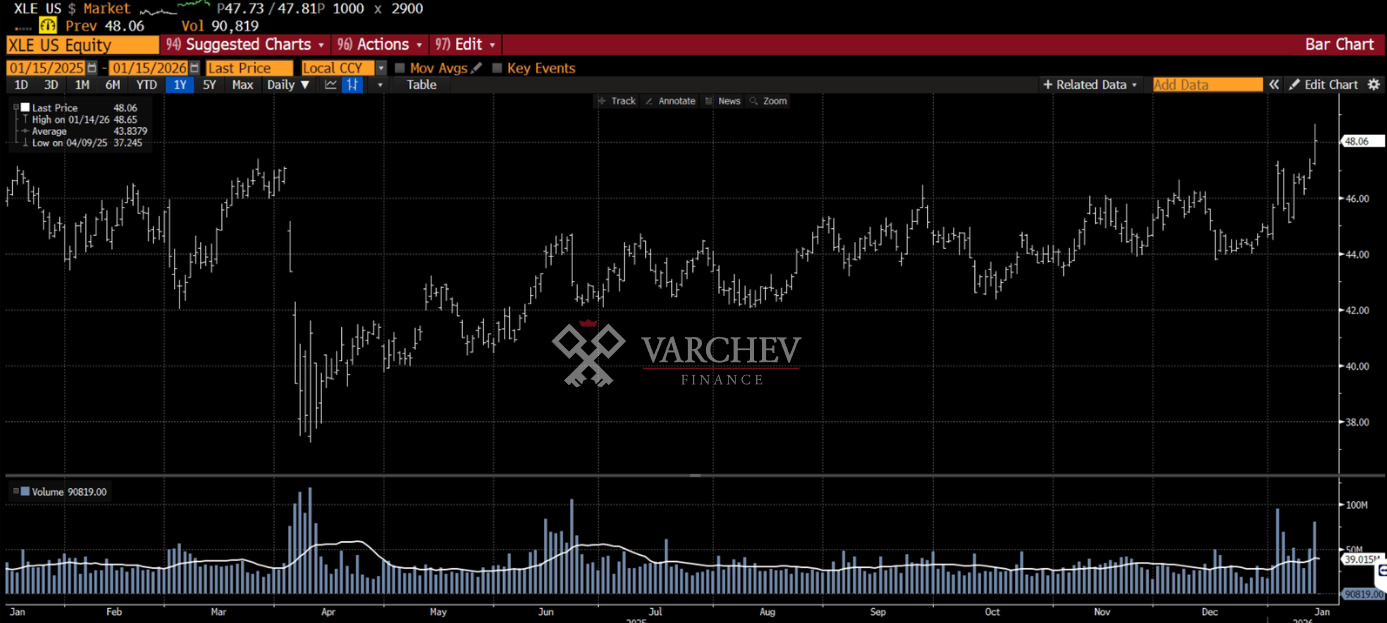
Every time the State Street Energy Select Sector SPDR Fund (XLE) posts a rally, investors are confronted with three key questions: whether the move represents more than a short-term bounce, how long XLE can continue to outperform the S&P 500, and whether such relative strength signals broader weakness in the equity market.
Below, we address these issues, along with one of the most significant technical formations in the energy sector in recent decades—linked to one of the market’s most recognizable companies.
XLE tests key resistance
On a daily basis, XLE has posted a strong advance since mid-December and is now climbing toward the upper boundary of its ascending price channel. The fund has even begun to break above this zone, which had previously capped every rebound since the April low.
If prices manage to hold above former resistance, this would mark a clear shift in market behavior. Until now, every similar move higher has been met with selling pressure and profit-taking. Investors’ willingness to buy at higher levels would signal that the current rally has the potential to develop into a more durable trend.

Break above a two-year downtrend
The weekly chart shows XLE moving above a key downward trendline that originates from the all-time highs reached in early April. The most recent test of this trendline in late 2024 clearly marked a peak, but the current move above it adds further evidence that the present upside attempt may be more sustainable.

XLE versus the S&P 500: still early days
Despite the recent gains, the energy sector has continued to lag the S&P 500 since late 2022. The current improvement in relative performance remains modest within the context of the longer-term downtrend, and there have already been several stronger and more prolonged recovery attempts in the past. This suggests the sector still needs to prove that this time is indeed different.

Historical periods of outperformance
Looking back to the early 2000s reveals two clearly defined periods in which the energy sector outperformed the broader market: from 2003 to 2008 and from 2020 to 2022. Both coincided with more challenging years for the S&P 500, but the relationship is not that straightforward.

Importantly, bear markets tended to emerge later—not at the beginning—of phases when XLE was leading. During much of the 2003–2008 period, the S&P 500 remained in an uptrend, and a similar pattern unfolded after 2020, when the broader index continued to rise until late 2021. This suggests that a potential new phase of long-term outperformance by XLE does not automatically imply a decline in the S&P 500.

The most significant breakout in decades
The largest holding in XLE is Exxon Mobil. On a quarterly timeframe, the company’s shares are breaking out of a wide trading range that has persisted for roughly three years, reaching new all-time highs. From this perspective, the past few years appear more like an extended consolidation phase rather than a topping formation.
Even more striking is the long-term view over a 50-year horizon. Historically, when Exxon Mobil breaks to new highs, the subsequent advance often unfolds over several years. Given the scale of the base formed between 2007 and 2021, one could argue that both the company and the sector as a whole are in the early stages of a long-term uptrend rather than a short-lived speculative rally.
This scenario brings the energy sector back into focus for investors—particularly in the context of sector rotation and the search for assets with clearer cyclical support.

Varchev Absolute Trader
борсова платформа
- Търгувай над 3000 финансови инструмента: Crypto, Форекс, Акции, Индекси, Суровини, ETF-и
- Използвай платформа с директно изпращане ордерите на борсите
- Cloud base платформа - твоят трейдинг сетъп на всяко устройство
- Market Sentiment - търгувай с настроенията на инвестиционите банки
- Top movers - най-горещите трейдове във всеки един момент
- Stocks scanner - филтрирай най-подходящите за твоя трейдинг стил пазарни инструменти
- Heat map - Търгувай в посоката на големите играчи
Meta Trader 5
- Търгувай Crypto, Форекс, Акции, Индекси, Суровини - всичко на едно място
- Автоматизирана търговия с интелигентни стратегии и роботи (Expert Advisors)
- Разширен технически анализ с хиляди индикатора и инструменти
- Сигурност и стабилност – платформа, доверена от милиони по света
- Нулев марджин при насрещни/хеджирани позиции
- Без комисиона при търговия със CFDs
- Светкавично изпълнение на сделките
Read more:

Login to comment
Comments:
Leave a comment